
Which big game ad strategies drove brand equity?
Another year, another monumental advertising moment during the largest U.S. sporting event. With all eyes on the field, the ad breaks, and the halftime show, brands put out some of their best - and most expensive - campaigns to capture the opportunity with a massive general audience.
But how successful were they in driving meaningful and measurable consumer sentiment changes?
For the third straight year, DISQO jumped head-first into a data-driven analysis of Big Game commercials. Using our huge audience of opted-in consumers who share their brand experiences, and our customer experience platform, we tackled these questions:
- Which commercials were most appealing to consumers?
- Which brands generated the biggest awareness lifts?
- Which advertising strategies drove the biggest overall impact?
Interested in our full, comprehensive report? Just click to download.
TLDR is a thing, so we have you covered right here if you’re looking for a quick preview. Read on to learn about our approach, high-level findings, and a couple of key takeaways for brands, agencies, and media companies looking to advance their advertising strategies.
Methodology primer
DISQO evaluated the impact of ads shown during the Big Game using our industry-leading Brand Lift product and our new agile Ad Testing product. There are two distinct, complementary, KPIs we have in our analysis:
- Creative appeal: We used our Ad Testing product to survey ~15,000 consumers immediately after the big game. Sixty-one ads were independently tested in the exact same way, within ~24 hours of the game’s end. Using closed-ended questions we captured overall reactions; perceptions of uniqueness and believability; and purchase intentions. After compiling the data for all 61 tests and weighting responses to ensure a representative sample, we compared ad scores to see which ones drove the most favorable reactions. Each ad received an overall score which was normalized and re-scaled to a number from 0 (minimum) to 100 (maximum) to indicate creative appeal.
- Awareness lift: We used our industry-leading Brand Lift product to survey ~15,000 nationally-representative consumers about their awareness of the brands who ran Big Game commercials. We probed their awareness of the 54 advertising brands, and all brands were randomized to control for order effects. Lift was computed for each brand by comparing brand awareness between exposed (watched the Big Game) and matched control (did not watch, but similar on age, gender, and income) consumers. As with creative appeal, lift scores were normalized and re-scaled to a number from 0 (minimum) to 100 (maximum) to indicate lift performance.
- Overall impact: After both a creative appeal score (0-100) and an awareness lift score (0-100) were computed, an overall advertising impact score was given to each brand. This score is the average of creative appeal and awareness lift, with 100 being the highest outcome possible.
Notable winners were…
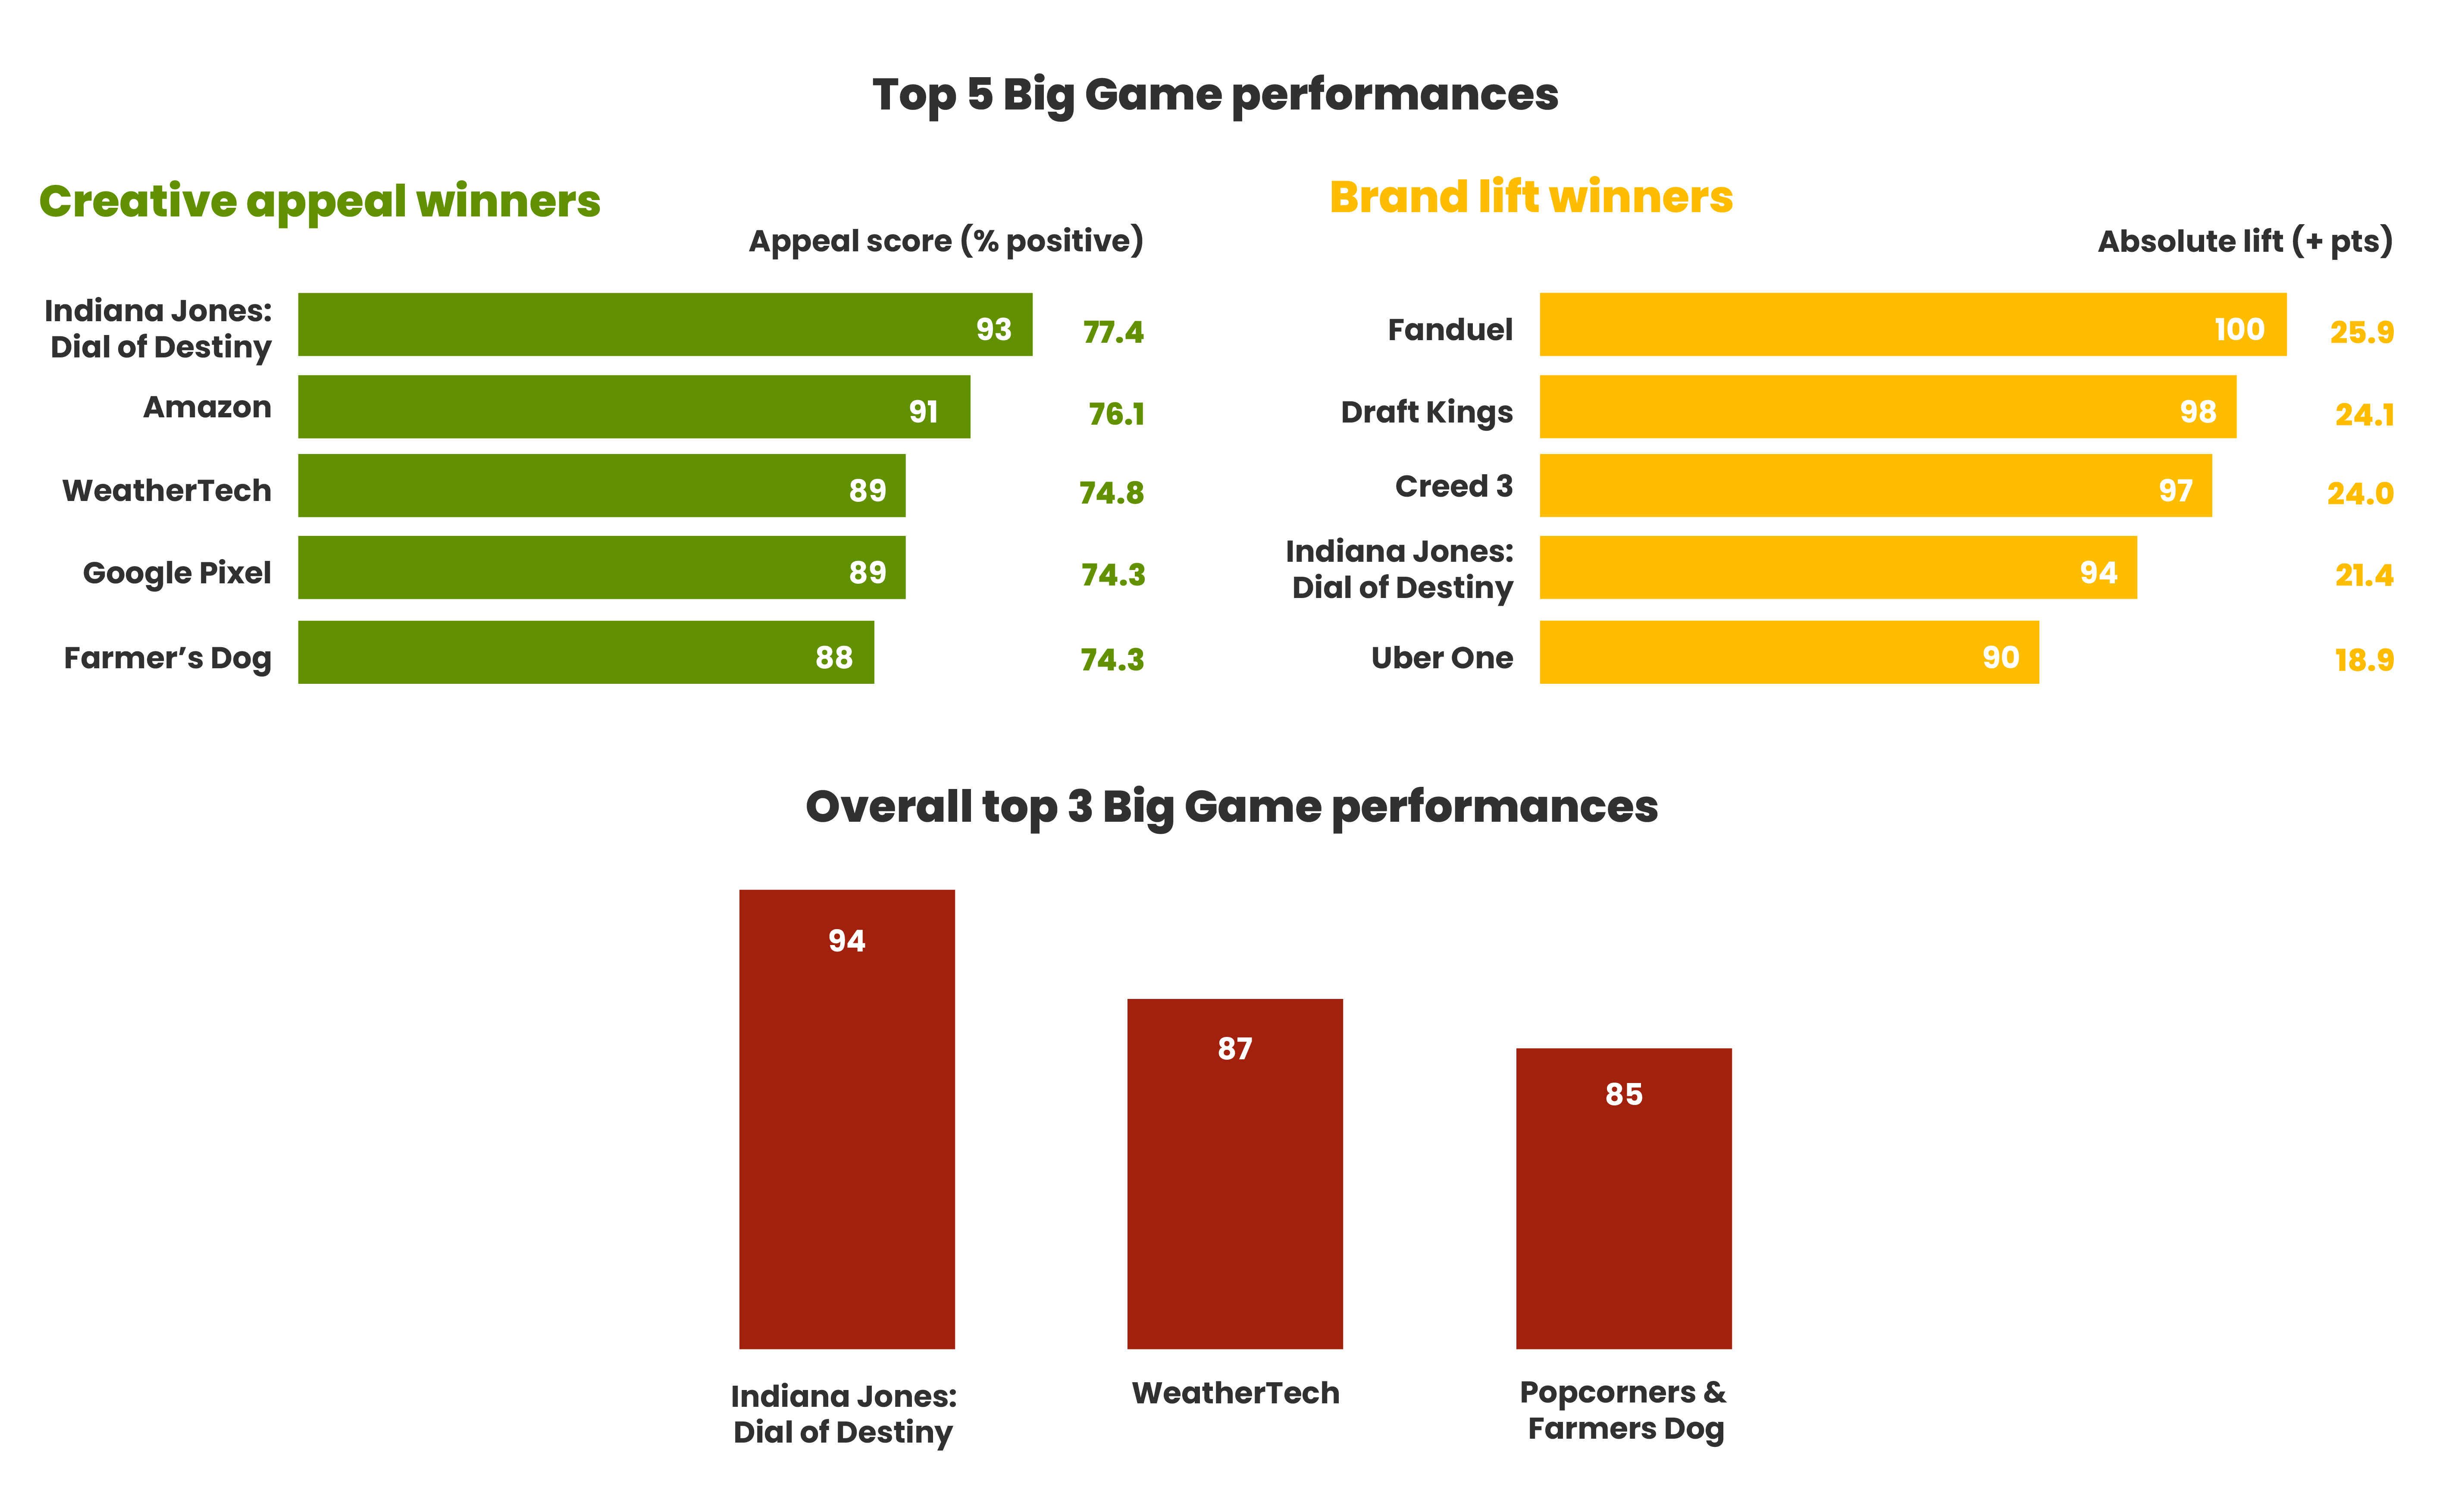
We saw a couple clear winners on creative appeal and awareness lift. We also saw a few brands who won on both metrics, making them some of the highest performers for overall impact.- Creative appeal: Indiana Jones, Amazon, WeatherTech, and Google Pixel were the leaders on creative appeal, rated consistently higher than other brands on perceptual metrics like overall positivity, brand linkage, memorability, and purchase intent. This variety of brands (and the variety of their underlying strategies) highlight that there is no one ‘secret sauce’ to a perfect Big Game ad. However, action, heart, and music proved to be solid ways to win over consumers.
- Awareness lift: Sports-betting platforms were the biggest winners on brand lift. FanDuel was able to generate over 25 points of awareness lift, putting it at the very top of the index, while Draft Kings was right behind at 24 points. For those attuned to the sports-betting landscape and the heavy promotions they’ve leveraged in various sports leagues, this is not necessarily surprising.
- Overall impact: Indiana Jones, WeatherTech, and Popcorners / Farmer’s Dog (tie) were the top three performances of the night. Again, our overall performance score equally weights creative appeal AND brand lift, so the spots that sit in our Top 3 were able to generate both positive consumer sentiment and brand-name stickiness simultaneously.
Key ad themes + relation to quantitative performance
Beyond giving each ad objective scores on these KPIs, we also dove into the themes and trends that predicted above-average (or below-average) ad impact. We coded all ads on several distinct dimensions (shortened list below; expanded within our report). With this metadata, along with each ad’s score on creative appeal and awareness lift, we examined which ad features and themes were associated with over- and under-performance.Learn even more!
This article is an abridged view of our comprehensive Big Game advertising insights, available in our full report (Big Game Brand Lift). Download now to dive into:
- Which ads performed best for creative appeal, brand lift, and overall?
- How did creative appeal and brand lift scores correlate with one another?
- What other advertising strategies influenced creative appeal and brand lift?
- What are the key implications for advertisers, agencies, and media companies?

Subscribe now!
Get our new reports, case studies, podcasts, articles and events
